Maintaining healthy blood sugar levels is essential for well-being, and monitoring your levels is a crucial part of maintaining a healthy lifestyle.
But simply tracking your blood sugar levels isn’t enough — interpreting the data accurately is just as important. Understanding how to monitor and interpret your blood sugar levels can help you identify how changes in blood sugar levels impact your health.
What is a blood sugar conversion chart and how do you read it?
A blood sugar conversion chart allows people to accurately interpret their blood sugar levels regardless of the unit of measurement used [1].
There are different types of charts available to help people convert their blood glucose levels from one unit of measurement to another. Two common types of blood sugar conversion charts are:
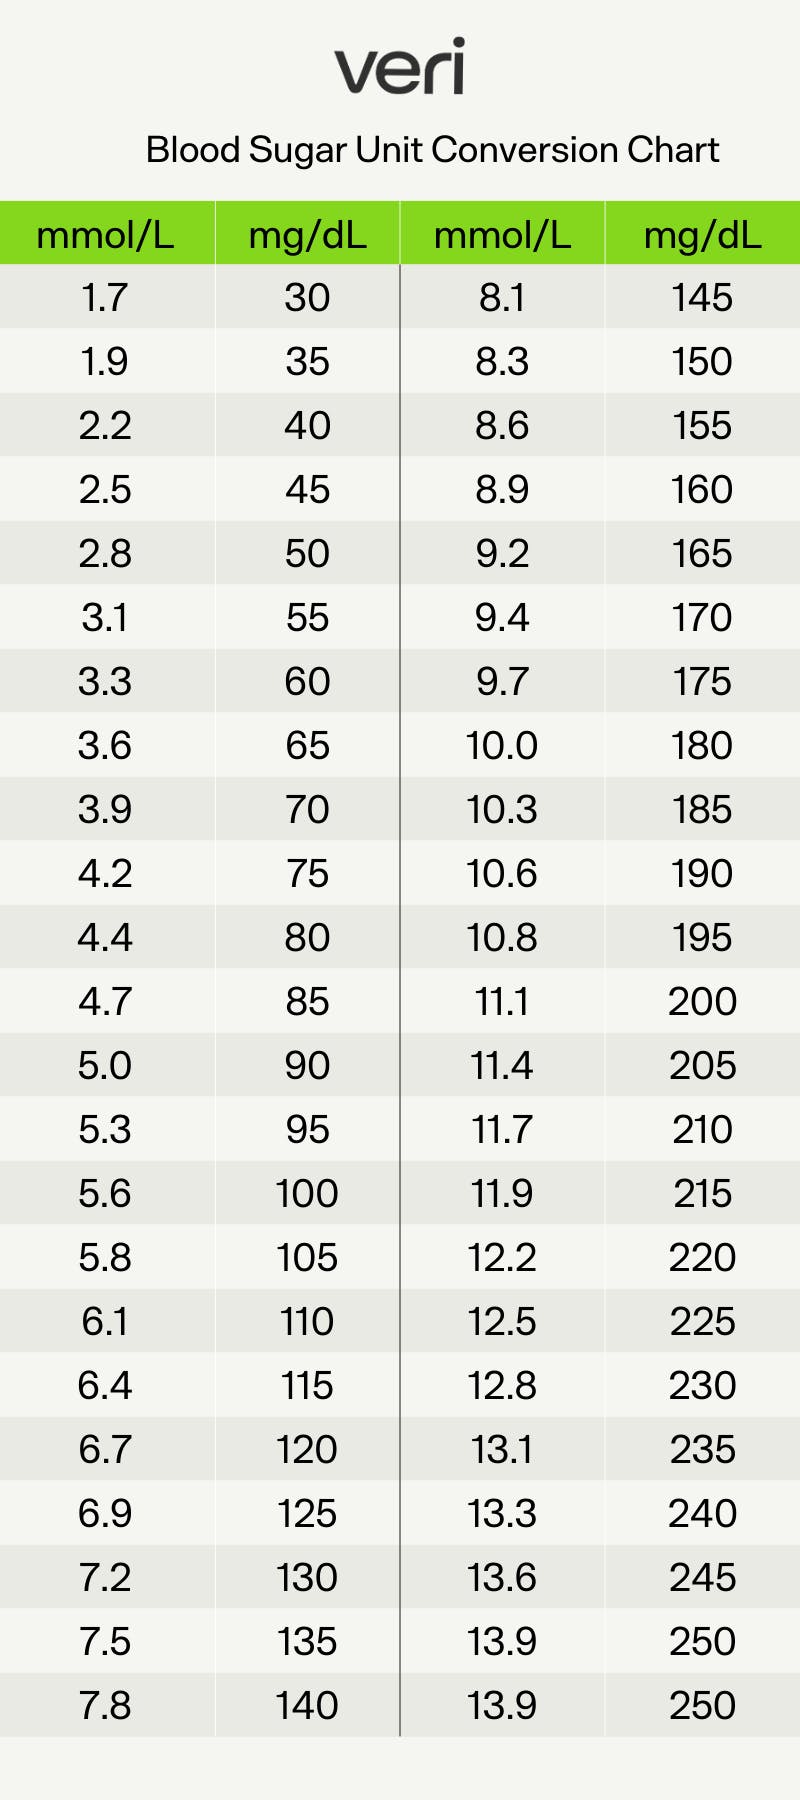
This chart allows you to convert your blood sugar levels between mg/dL and mmol/L.
1. Converting between mg/dL and mmol/L
Blood sugar levels are typically measured in milligrams per deciliter (mg/dL) in the United States, but in most other countries, they are measured in millimoles per liter (mmol/L). This chart is particularly useful for people who travel between countries or use devices with different units of measurement.
To convert between the two without a chart, it’s simple: mg/dL = 18 × mmol/L. To get mmol/L from mg/dL, simply do the reverse and divide mg/dL by 18.
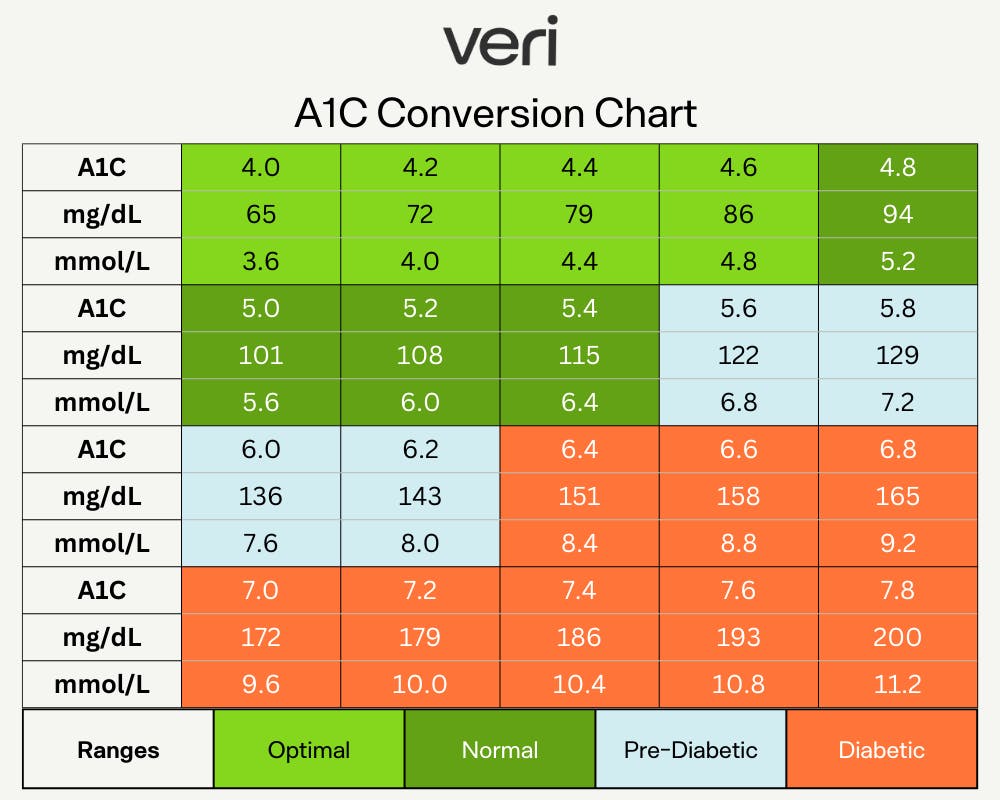
This chart allows you to estimate your A1C based on your blood glucose levels, without having to get a blood test.
2. Converting blood glucose levels to A1C
A1C is a blood test that measures the average blood glucose level over the past 2-3 months and is expressed as a percentage. The blood glucose to A1C conversion chart can provide an estimation of how well blood glucose levels are being managed over time, without actually having to get a blood test. If you know your average blood glucose, the conversion chart gives you an estimation of your A1C based on this average.
You can also use our A1C calculator:
What should your glucose levels be?
The normal range for blood glucose levels varies depending on the individual's age, health status, and other factors. It is also important to note that blood glucose levels can vary depending on food intake, exercise, stress, and medication use [2].
Ideal fasting levels
Fasting blood glucose level refers to the amount of glucose in the blood after a period of not eating or drinking anything, typically 8 hours or more. A fasting blood glucose level between 70 and 100 mg/dL (3.9 and 5.5 mmol/L) is considered normal. Morning fasting glucose (your blood sugar levels upon waking) is an indicator of insulin sensitivity and long-term health outcomes — if you know morning fasting blood glucose levels above 100 mg/dL (5.6 mmol/L) is one indicator of insulin resistance [3].
"Normal" glucose levels
Normal blood glucose level refers to your blood sugar level at any time of the day, whether before or after meals. Blood glucose levels before meals should generally be between 70 and 100 mg/dL (3.9 and 5.6 mmol/L) for healthy, non-diabetic adults [4]. Blood glucose levels should generally be below 140 mg/dL (7.8 mmol/L) two hours after eating.
High glucose levels
A blood glucose level above 180 mg/dL (10.0 mmol/L) is considered high in people without diabetes.
Consistently high blood glucose levels — i.e., when levels remain elevated after 8-10 hours of not eating or are greater than 140 mg/dL or 7.8 mmol/L two hours after a meal — are associated with insulin resistance, which can affect everything from your mood, focus, and hunger levels to longer-term complications like diabetes, insulin resistance, and cardiovascular disease.
What are blood glucose spikes and what do they mean?
Your blood glucose will naturally rise and fall throughout the day — the only way to avoid an increase is to avoid all carbohydrates, which isn’t what necessarily works best for everyone’s body. Having the flattest line possible isn’t the end goal of monitoring your glucose levels.
A sharp mountain range on your graph indicates a rapid increase in blood glucose (and thus insulin) levels, typically after eating something high in refined carbs.
Watch out for these spikes
While diet is often the biggest reason for spikes, factors like meal timing, genetics, dehydration, and PCOS can all play a role as well. In general, blood sugar spikes are considered problematic when they are consistently high or occur frequently. High blood sugar levels, also known as hyperglycemia, can cause symptoms such as lethargy and fatigue.
Your glucose levels will rise after eating as your food gets digested and glucose enters the bloodstream, but after about 2 hours, those levels should fall beneath 140 mg/dL or 7.8 mmol/L.
Eating too many simple carbohydrates or consuming high-glycemic foods may cause a problematic increase in glucose levels. These spikes can result in a severe drop in glucose levels once insulin has done its job and cleared glucose from your blood. This drop in glucose can cause you to crave sugar as your body tries to bring your glucose levels back to normal.
Don't worry about these spikes
On the other hand, some spikes aren’t a cause for concern.
A blood sugar spike after a HIIT workout, for instance, is normal, since physical activity causes the body to release stored glucose to use for energy [5]. However, if blood glucose levels remain don’t return to normal levels about 1-2 hours after the workout, it may indicate an issue with blood glucose management [6].
In the morning, many individuals also experience a rise in glucose levels as the liver releases glucose to prepare the body for being active — also known as the dawn phenomenon. This type of surge in glucose is also normal.
If you notice that you're experiencing a biphasic curve, or one peak about 30-60 minutes after you eat a meal followed by another peak 30-60 minutes after that, don't worry. While research is still early, biphasic curves suggest that you may have higher insulin sensitivity and overall lower glucose level.
How to tell if a spike is "bad"
Determining whether a blood sugar spike is "bad" can depend on several factors, such as your health status, the cause of the spike, and the frequency and duration of the spikes [7]. If you’re using a continuous glucose monitor, you can see a couple of data points that may be helpful in determining whether a spike is bad:
- Incline. The incline of your spike — i.e., how quickly and how much your levels rise after eating — may have health implications. For example, a 20mg/dL rise over 20 minutes isn’t the same as a 20mg/dL rise over 2 hours. Steep inclines are often caused by high-glycemic index or high-glycemic load foods, which can increase your risk of developing diabetes.
- Excursion time. Quite simply, this refers to the time your glucose levels are in a healthy range (70-100 mg/dL or 3.9-5.5 mmol/L for non-diabetics) and the time they’re above or below this range. You want to minimize the time you spend outside of the healthy range, since research has shown that glucose fluctuations or high variability are worse for blood vessel function and health than stable but elevated levels [8].
- Area under the curve. The area under the curve represents the change in glucose after eating [9]. Specifically, it captures glucose change for approximately 2 hours following a meal. The higher or longer the rise, the higher the area under the curve will be for the meal. If your glucose rises sharply and takes a while to come down after a meal (2 hours or more), this may be indicative of a meal too high in simple carbs, glucose intolerance, or IR.
Some steps you can take to manage blood sugar spikes include [10]:
- Monitoring your blood glucose levels regularly can help you identify blood sugar spikes and take corrective action as needed.
- Eating a balanced diet that is low in sugar and simple carbohydrates can help prevent blood sugar spikes from occurring frequently.
- Regular physical activity can help improve blood glucose management and prevent blood sugar spikes.
- Managing stress levels through techniques such as meditation, yoga, or deep breathing exercises can decrease likelihood of blood sugar spikes.
What do low blood glucose levels mean?
Low blood glucose levels, also known as hypoglycemia, occur when the amount of glucose in the blood falls below normal levels [11]. While the specific threshold for hypoglycemia can vary depending on the individual, blood glucose levels below 70 mg/dL (3.9 mmol/L) are generally considered low.
Symptoms of low blood glucose levels include:
- Shaking or trembling
- Sweating
- Palpitations or rapid heartbeat
- Fatigue or weakness
- Confusion or difficulty concentrating
- Irritability or mood changes
- Blurred vision
- Headache
- Nausea or stomach discomfort
Low fasting glucose levels can be caused by a variety of factors, including not eating enough food, exercising too much without adequate calories, or drinking alcohol without consuming food. Rebound hypoglycemia can occur after consuming a large meal that is high in carbohydrates and/or fats.
Nocturnal hypoglycemia can occur during sleep and be caused by various factors such as too much insulin or delayed meal. In some cases, low fasting glucose levels can also be a sign of an underlying medical condition such as an adrenal or pituitary gland disorder. One example is polycystic ovarian syndrome (PCOS), which can lead to insulin resistance and cause hypoglycemia in some cases.
Why you should use a CGM
Blood glucose levels can be measured using several methods, including:
- A1C test. This test measures the average blood glucose levels over the past two to three months by assessing the amount of hemoglobin that is glycated (has glucose attached).
- Glucose tolerance test. This test involves drinking a glucose solution and having blood glucose levels checked at specific intervals over the course of several hours.
- Finger prick test. This test involves pricking the finger to obtain a small sample of blood, which is then placed on a test strip and inserted into a blood glucose meter. The meter provides a reading of the current blood glucose level (i.e. only at the moment the test was taken).
- Continuous glucose monitoring (CGM). This involves wearing a device that continuously measures blood glucose levels throughout the day.
Although each of these has its reason for use, continuous glucose monitoring (CGM) has several advantages over other methods of measuring blood glucose levels [7].
It’s often preferred as a tool to help measure and interpret blood glucose results as it provides real-time information on blood glucose levels. This allows the user to detect individual trends in blood glucose levels over time, such as blood glucose spikes or fluctuations that occur during sleep, with stressors, or after meals. Additionally, CGM eliminates the need for frequent finger pricks or trips to a healthcare provider’s office for tests.
Key takeaways
Interpreting conversion charts and knowing what blood sugar levels mean can have profound impacts on understanding your individual metabolic health.
- Aim to stabilize blood glucose levels by keeping between 70 and 100 mg/dL (3.9 and 5.6 mmol/L) the majority of the time, especially during periods of fasting.
- While blood sugar spikes after physical activity or eating are not inherently bad, spikes can become problematic for your health if they happen frequently and last for long periods of time.
- To prevent blood glucose spikes, it is important to eat a balanced diet that includes a variety of foods and nutrients, lower stress levels, and exercise regularly.
- Monitoring dips in blood sugar levels can be just as important as spikes, and can provide insight into diet and lifestyle factors that can improve for better health.
- Using a continuous glucose monitor is the preferred method of measuring and tracking blood sugar, as it shows how your individual levels vary on a day-to-day basis.
References:
- https://professional.diabetes.org/diapro/glucose_calc
- https://www.cell.com/cell/fulltext/S0092-8674(15)01481-6
- https://diabetes.org/diabetes/a1c/diagnosis
- https://www.diabetes.co.uk/diabetes_care/blood-sugar-level-ranges.html
- https://www.ncbi.nlm.nih.gov/pmc/articles/PMC3494382/
- https://academic.oup.com/jcem/article-abstract/76/3/566/2649676
- https://journals.plos.org/plosbiology/article?id=10.1371/journal.pbio.2005143
- https://pubmed.ncbi.nlm.nih.gov/18299315/
- http://ncbi.nlm.nih.gov/pmc/articles/PMC6214468
- https://www.cdc.gov/diabetes/managing/manage-blood-sugar.html
- https://www.sciencedirect.com/science/article/abs/pii/S1499267117308201