Oftentimes Veri users reach out with the question, “Why do I see two spikes on my glucose graph after I eat?”
This double spike, also known as a biphasic curve (or biphasic glucose curve) is characterized by two distinct glucose peaks following a meal. A biphasic curve is different from a single glucose peak after a meal, also known as a monophasic curve.
So what exactly is the difference between a monophasic and biphasic curve, and what does this suggest about your metabolic health?
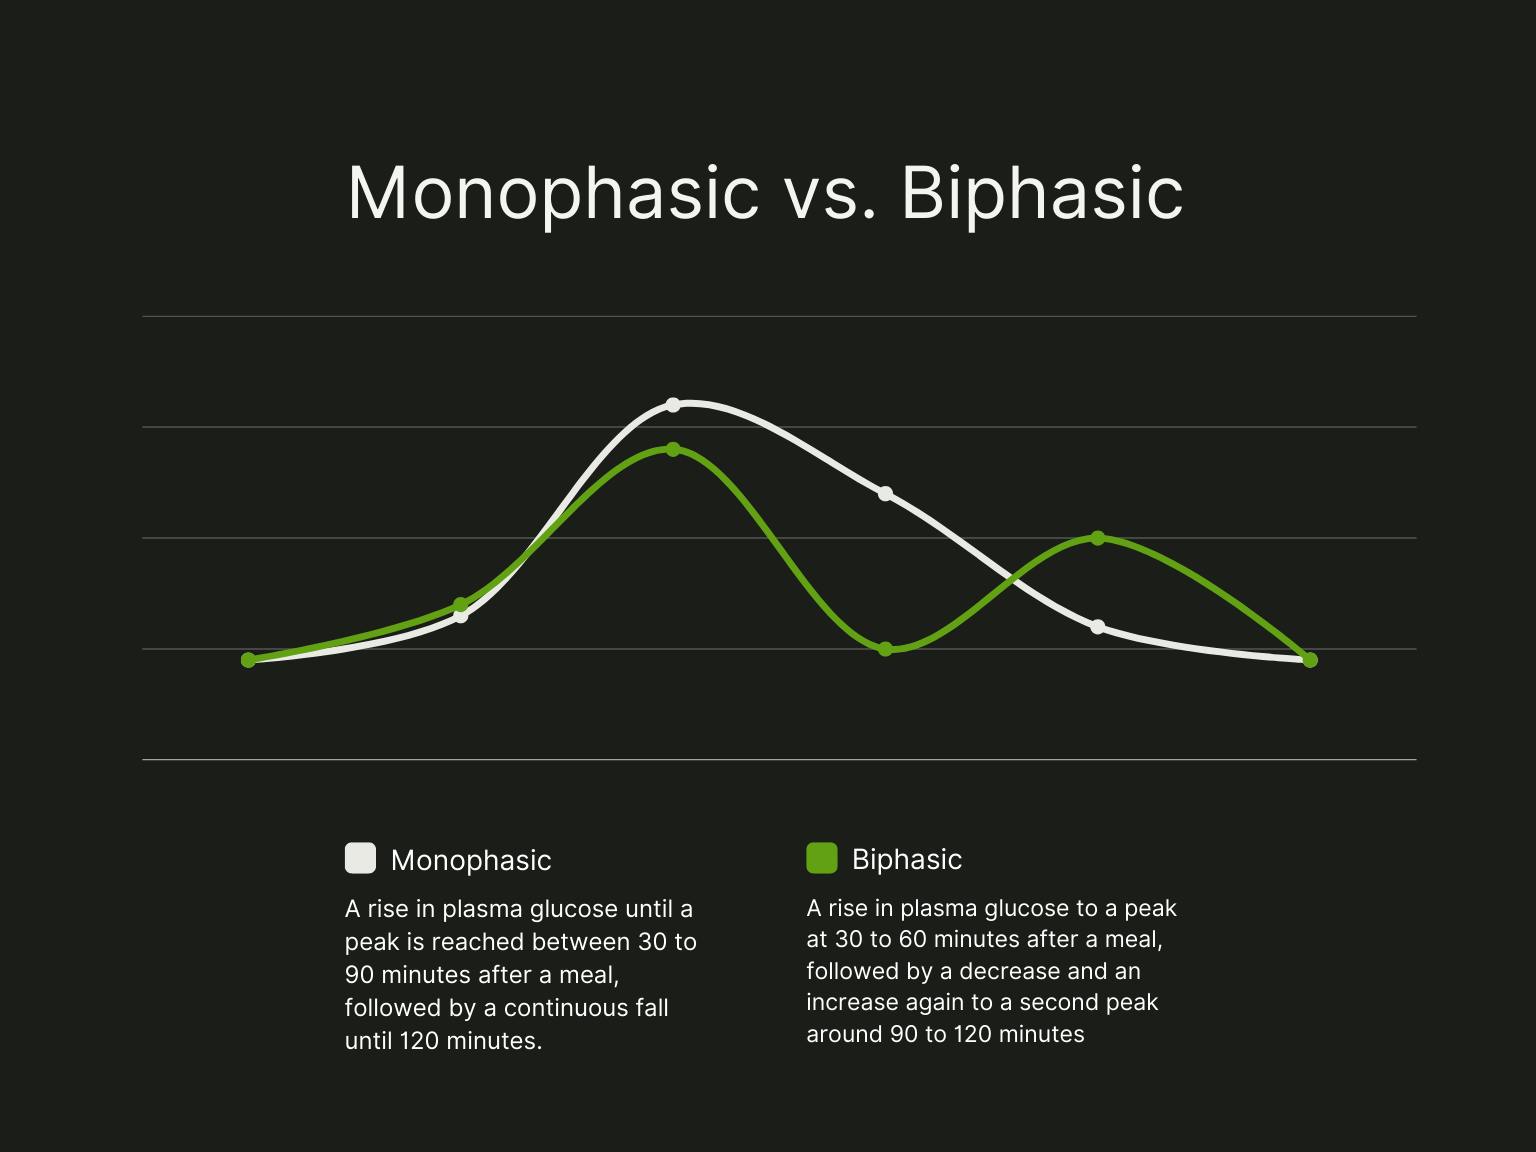
Figure 1.
Monophasic vs. biphasic curves
By definition, a monophasic curve is a rise in plasma glucose until a peak is reached between 30 to 90 minutes after a meal, followed by a continuous fall until 120 minutes.
The mechanism behind monophasic and biphasic glucose curves
To understand why you may see a monophasic or biphasic glucose curve following a meal, it’s important to first understand the role of insulin in glucose metabolism.
After you eat and glucose enters the bloodstream, insulin is secreted in a dynamic process to shuttle glucose out of the bloodstream and into your cells. Insulin is released from beta cells in the pancreas and is the key hormone in keeping your blood sugar balanced.
Insulin is secreted in two phases to most effectively reduce blood glucose levels. The first phase of insulin release occurs rapidly and lasts for only a few minutes, while the second phase occurs later and is more sustained.
Studies have shown a monophasic glucose curve following a meal to be associated with decreased or impaired first-phase insulin secretion [1].
In other words, single-spike curves may be associated with an impaired insulin response. Another study demonstrated that a decrease in the first phase of insulin secretion may be associated with an increased risk of developing type 2 diabetes (T2D) [2].
A biphasic glucose curve may be a result of better insulin secretion in the first phase in addition to improved insulin sensitivity, which creates two peaks.
What does the research say about biphasic curves?
One study investigated the relationship between the shape of a glucose concentration curve, different metabolic risk profiles, and risk of T2D [3]. A cohort of 121 adult subjects underwent an oral glucose tolerance test (OGTT) and were assigned to either a monophasic or biphasic glucose response group.
Researchers found that those with a monophasic curve following an OGTT tended to have higher fasting and 2-hour plasma glucose levels, lower insulin sensitivity, and impaired beta-cell function.
Another study looked at the shape of a glucose response curve to an oral glucose tolerance test in 277 obese adolescents without diabetes [4]. Subjects were categorized into a monophasic or biphasic response group based on which curve type they experienced following a 2-hour OGTT.
Researchers found that the monophasic curve group had significantly lower insulin sensitivity and beta-cell function in comparison to the biphasic group. These are two significant biomarkers of T2D, signifying a higher risk for metabolic syndrome [4].
A third study analyzed the difference between first-phase and second-phase insulin secretion in obese adolescents with normal glucose tolerance, impaired glucose tolerance, and T2D [5].
Researchers found subjects with impaired glucose tolerance to have significantly lower first-phase insulin levels when compared to subjects with normal glucose tolerance. Subjects with T2D displayed a more profound defect in insulin secretion in both first and second-phase levels.
This suggests that pre-diabetes, or impaired glucose tolerance, is an intermediate stage in the impairment of insulin secretion, with T2D having a more pronounced effect for both first and second phase of insulin secretion [5].
Key Takeaways
While we can identify trends in research about biphasic glucose curves, it’s important to keep in mind that this research is still evolving and there is not one concrete conclusion. The majority of research on this topic has been done in people with T2D or impaired glucose control. More research is needed in healthy subjects to gain further insights into the significance of glucose curve shapes.
If you experience monophasic curves, the best thing you can do is pay attention to your nutrition, sleep, and exercise. Tracking your glucose with a CGM and habits within the Veri app provide a useful platform to better identify patterns and rectify health-harming behaviors.
- A biphasic curve may be associated with higher insulin sensitivity, lower glucose levels, and a lower rate of metabolic syndrome.
- While the shape of your glucose curve may help provide some insight on your metabolic health, this information may be hard to extrapolate. Use this as an additional window into your metabolic health.
- There is no need to try to eat for a biphasic glucose curve. Most research analyzes a glucose curve in response to an oral glucose tolerance test, where subjects are given 75 grams of glucose at a time. Generally, it is best to eat for stable blood glucose.
References:
- https://www.ncbi.nlm.nih.gov/pmc/articles/PMC3104758/
- https://pubmed.ncbi.nlm.nih.gov/5338206/
- https://www.ncbi.nlm.nih.gov/pmc/articles/PMC6097323/
- https://www.ncbi.nlm.nih.gov/pmc/articles/PMC4955931/
- https://www.ncbi.nlm.nih.gov/pmc/articles/PMC2606839/
- https://www.researchgate.net/figure/Representative-glucose-response-curves-after-a-2-h-oral-glucose-tolerance-test-in-two_fig3_268234449